A recurring strand in Exeter's math curriculum
Graphical representations arise in a variety of settings throughout our problem sets. Here are a few examples.
Math 1: A cylindrical container is filled to a depth of d cm by pouring in V cc of liquid. Draw a plausible graph of d versus V. Recall that d versus V means that V is on the horizontal axis.
(Math 1, #752)
Math 2: Find an equation that says that P = (x, y) is equidistant from F = (2, 0) and the y-axis. Plot four points that fit this equation. The configuration of all such points P is called a parabola.
(Math 2, 33#1)
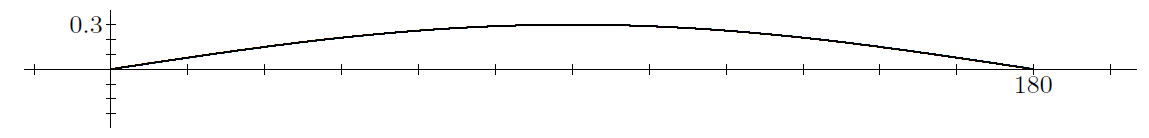
Math 3: Interpreted in degree mode, the equation y = 0.3cos(36000t)sin(x) models the motion of a stretched, vibrating string that is 180 centimeters long (x = 0 is one end of the string and x = 180 is the other). The amplitude of the vibration is 0.3 cm.
Verify that the period of the vibration is 0.01 second. This means that the string vibrates 100 times per second.
Taking a photo of the string corresponds to choosing a t-value. For example, the diagram shows the string at the instant t = 0. Notice that the amplitude has been exaggerated to make it more visible. Sketch photos of the string for t = 0.001, t = 0.0025, t = 0.003, and t = 0.005 second.
How far does the center of the string move during one complete vibration? Does the center of the string move with constant speed? Calculate an approximate value for the speed of the center of the string when t = 0.0025 second.
(Math 3, 70#5)
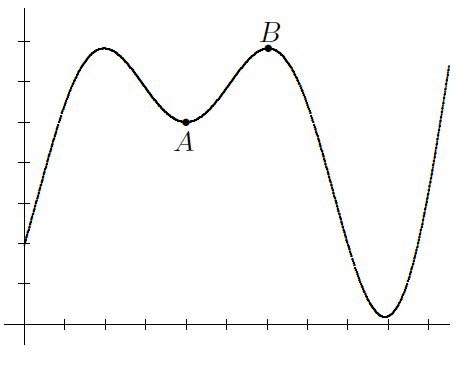 Math 4: The diagram shows the graph of y = f(x), which can be interpreted in the following two ways:
It shows the elevation during a hike along a mountain ridge, as a function of time. During the part of the hike represented by the curve that joins point A to point B, there is a moment when the hiker is working hardest. If you had a formula for the function f, how would you calculate this time?
(b) It represents a bird’s-eye view of a winding road. As you drive along the section of road from point A towards point B, there is a point where the car stops turning to the left and starts turning to the right. If you had a formula for the function f, how would you locate this point?
(Math 4, 50#7)
Other strands that arise throughout our problem sets: